Home · The Ordane Journal · Rules and mechanics · Forex Indicator Trading: Signals and Payout Rules
Forex Indicator Trading: Signals and Payout Rules
Indicator trading in forex means using calculations from historical chart data to define trading conditions, with each signal written down before execution. Broker OANDA's relative strength index (RSI) guide describes 70 and 30 as reference levels for possible overbought and oversold conditions, not automatic trade instructions (retrieved 2026-10-19).
Ordane sells one product, the Ordane Instant Account: direct access, no evaluation phase and no challenge, on simulated capital (Ordane Rulebook v1.5, §1, retrieved 2026-10-19).
This article is for information only and is not investment, financial, or tax advice.
Ordane accounts operate on simulated capital. No live funds are traded and no deposits are accepted. Payouts depend on simulated performance under Rulebook v1.5; no level of performance is typical or assured.
An RSI reading above 70 can indicate possible overbought conditions and below 30 possible oversold conditions, according to OANDA (retrieved 2026-10-19). OANDA's moving-average guide describes a cross followed by a candle close as one common signal rule (retrieved 2026-10-19). Neither condition overrides written account rules.
What is indicator trading in forex?
Indicator trading in forex means using calculations from past price data to define entry or exit conditions. OANDA's RSI guide describes a momentum oscillator; IG's Bollinger guide explains volatility-based bands; and OANDA's average directional index (ADX) guide addresses trend strength (retrieved 2026-10-19). These tools answer different questions, so a trader should document what each signal means before using it.
The roles of the indicators named in this article, reduced to rows (each row restates a fact cited in this article; no new data):
| Indicator | Role as documented | Source |
|---|---|---|
| Bollinger Bands | adapt bands to volatility | IG Bollinger guide, retrieved 2026-10-19 |
| RSI | above 70 or below 30 can flag possible stretched conditions | OANDA, retrieved 2026-10-19 |
| Moving averages | use historical prices and can lag | OANDA, retrieved 2026-10-19 |
| ADX | gauges trend strength, not a direction forecast | OANDA, retrieved 2026-10-19 |
Indicator trading is any approach where an entry or exit decision uses a calculation plotted on the chart rather than discretionary reading of candles alone. OANDA's guide to integrating indicators discusses combining tools with other analysis; the combination still requires a written rule and testing (retrieved 2026-10-19).
Choosing tools for trend and momentum questions
For trend questions, OANDA's moving-average guide explains the lag of price-derived averages, while its ADX guide distinguishes trend strength from direction (retrieved 2026-10-19). For momentum, use a separate condition such as RSI. A documented combination is easier to review than overlapping signals.
Can indicator trading actually produce a real payout?
Yes, conditionally: the indicator system only matters if the account that trades it stays inside the rules until payout day, and the payout question is decided by the firm's terms, not by the indicators. For Ordane specifically, Rulebook v1.5, §3 makes the first withdrawal available seven calendar days after activation, subject to the other rules (retrieved 2026-10-19). Eligibility is not evidence that a particular trader will earn a payout.
Screening logic: combining indicators instead of trusting one
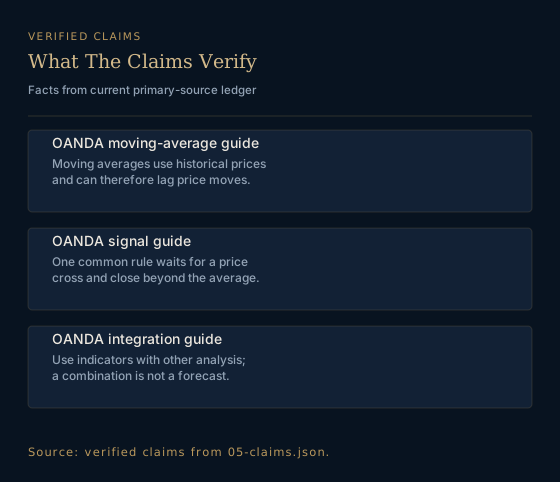
The cited OANDA integration guide discusses using tools together with other analysis. Write a specific validity rule, such as cross-and-close, then test it. Whether a firm pays at all is a separate question decided by its payout terms, and no trading style causes a payout by itself.
The cross-and-close rule: when a signal is valid
Every indicator signal needs a validity rule, or you'll trade noise. OANDA's moving-average guide gives one common rule: a signal is considered valid when price action crosses and closes above or below a moving average, not when price merely pokes through the line and retreats (retrieved 2026-10-19). Whether price pokes through the line and retreats is exactly what the rule exists to filter: the cited rule is that the close, not the touch, validates the signal. Writing this rule into your plan (and logging the candle close for each entry) turns an indicator strategy into something checkable: both for you and for anyone reviewing the account later.
Which hidden rules can zero your withdrawal?
Three distinct rule categories can affect a withdrawal even when the chart signal is valid: automation practices, news-event practices, and loss limits. Their exact scope depends on the firm. For Ordane, Rulebook v1.5, R-6 and R-2 prohibits high-frequency or bulk automated exploitation and paired opposing orders straddling news; its daily loss limit is 3% (retrieved 2026-10-19). R-1 separately sets a 12% static maximum drawdown. Our comparison is simple arithmetic, 12 divided by 3 equals 4: the two percentage ceilings differ by a factor of four, but they measure different bases and cannot be added or treated as four permitted loss days. It does not impose a blanket ban on ordinary expert advisors or all news trading.
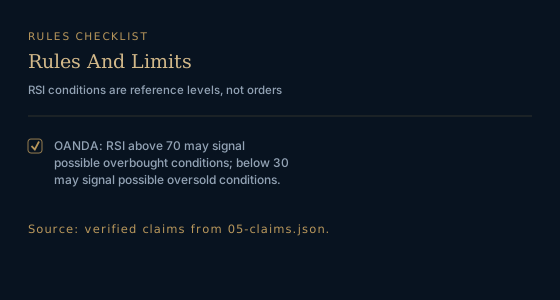
The closed-list wording matters. Ordane's Rulebook v1.5, R-6 says: "If a behavior is not listed in this section, it is not a violation." This is a quotation of the rule, not a conclusion about another firm's policy (retrieved 2026-10-19).
Automated indicator systems vs the EA and copy-trading ban
Many indicator traders eventually automate: "when RSI crosses 70, short the pair." But whether automated systems are allowed is firm-specific policy, not market mechanics. Before you wire your indicator logic into an expert advisor (EA) on a prop firm account, check the firm's position on automated systems in our guide to prop firm copy trading and EA rules. Ordane's Rulebook v1.5, R-6(b) and Appendix A-2 targets high-frequency or bulk automated exploitation, not the fact that software placed a trade (retrieved 2026-10-19); other firms publish their own boundaries.
News-filtered indicators: check the written rule
RSI does not know a central bank decision is ten minutes away. A reading above 70 before an announcement is a chart condition, not an instruction to short. Some firms restrict trades around high-impact news; compare their written terms with our guide to prop firm news-trading rules. Ordane's Rulebook v1.5, R-6(d) prohibits straddling news releases with paired opposing orders (retrieved 2026-10-19). Check the applicable rule before trading.
Lagging indicators, late exits and the daily loss limit
Moving averages are lagging indicators because they use historical prices (OANDA, retrieved 2026-10-19). A trader who chooses a moving-average crossing as an exit rule must check how that rule behaves in a fast reversal; no cited evidence here quantifies a typical delay or loss. Separately, Ordane Rulebook v1.5, R-2 sets a 3% daily loss limit (retrieved 2026-10-19). Compare any chosen exit and position size with the applicable daily loss limit; static versus trailing drawdown is a distinct account-rule comparison, not an outcome inferred from an indicator.
Can a prop firm still exist when an indicator strategy reaches payout?
An indicator cannot establish whether a particular prop firm will remain solvent and pay a future withdrawal. Ordane Rulebook v1.5, G-1 and G-2 specifies a 24-hour payment deadline after approval and a remedy if missed, subject to documented fraud or KYC review and declared force majeure exclusions, each capped at ten business days (retrieved 2026-10-19); the contractual term does not prove future solvency or a record of past payments. Its PR-2 says dated payout-performance reporting begins with the first month in which a payout is requested; until then no payout history is claimed. A chart signal cannot establish payment capacity.
Why payout timing is a separate check
The time to a first payout depends on the firm's rules and the strategy's pace; this article cites no payout-timing data. Check the counterparty's verifiable payment record before committing months.
How to check payout history before committing months
Before you commit months to any strategy, the counterparty check is the one covered in how to audit a prop firm: where the terms are published, what the payout record shows, and who verifies it. This article cites no data on any firm's payout history, so it names no examples.
What does it cost to run an indicator strategy?
There is no single price for an indicator strategy: the chart tools, platform and account may have separate terms. For a concrete account example, Ordane Rulebook v1.5, §1 lists one-time prices from $59 for a $2,500 simulated account to $999 for a $100,000 simulated account, with no recurring account fee (retrieved 2026-10-19). A checkout promotion can change the amount paid. These are account prices, not indicator-package or platform prices; the cited sources do not provide a comparable price for those items.
Verified facts at a glance
| Fact from the research ledger | Source |
|---|---|
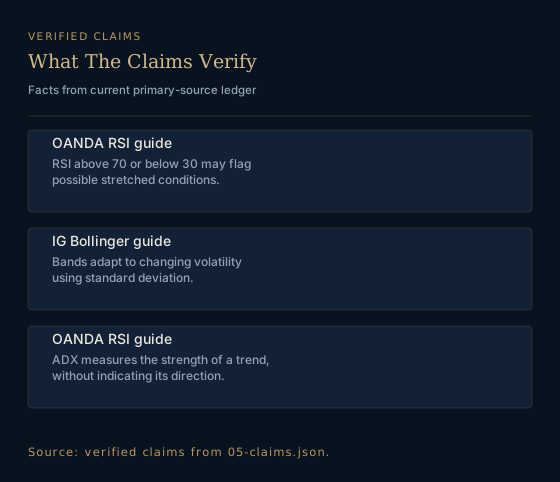
| RSI above 70 or below 30 can flag possible overbought or oversold conditions. | OANDA RSI guide, retrieved 2026-10-19 |
| Bollinger Bands adapt to volatility through standard deviation. | IG Bollinger guide, retrieved 2026-10-19 |
| Moving averages can lag because they use historical prices. | OANDA moving-average guide, retrieved 2026-10-19 |
| ADX addresses trend strength rather than direction. | OANDA ADX guide, retrieved 2026-10-19 |
Frequently Asked Questions
Direct answers about this topic.
What is indicator trading in forex?
Indicator trading uses calculations from historical chart data to define trade conditions instead of raw price action alone. OANDA's RSI guide explains momentum reference levels, while its moving-average guide explains price-derived averages. Retrieved 2026-10-19.
Which indicators serve different forex analysis questions?
Traders choose indicators for distinct questions: OANDA's RSI guide addresses momentum, IG Bollinger guide addresses volatility, and OANDA's ADX guide addresses trend strength. No fixed shortlist fits every strategy. Retrieved 2026-10-19.
Is RSI above 70 a sell signal?
OANDA says RSI above 70 may indicate overbought conditions and below 30 may indicate oversold conditions. Treat those readings as warnings for further analysis, not standalone buy or sell orders. Retrieved 2026-10-19.
Why do moving averages follow price?
OANDA describes moving averages as lagging because they use historical prices. A late exit in a fast reversal is a practical risk to test against the loss limits in a particular firm's written terms. Retrieved 2026-10-19.
Can I trade indicators on a prop firm account without breaking the rules?
Only the particular prop firm's written terms can answer whether indicator trading is allowed. This article does not establish a universal EA, news-window, or loss-limit rule. For signal validation, OANDA says a moving-average signal commonly requires price to cross and close above or below the average, rather than merely touch it. Source: How to Use Moving Averages | OANDA. Retrieved 2026-10-19.
Sources
- OANDA: Understanding the Relative Strength Index oanda.com Retrieved 2026-10-19.
- IG: What Are Bollinger Bands? ig.com Retrieved 2026-10-19.
- OANDA: How to Use Moving Averages oanda.com Retrieved 2026-10-19.
- OANDA: Guide to the DMI ADX Indicator oanda.com Retrieved 2026-10-19.
- OANDA: How to Integrate Forex Indicators oanda.com Retrieved 2026-10-19.